How the stock markets story is scripted – Part 2
In last week’s blog we discussed the role of institutional investors on the price movement of the stock market using the subprime mortgage crisis as the reference time-period. We will continue our analysis but with respect to the current market situation.
Before we start drawing parallels between the current stock market crash with the 2008 crash we should understand that no two events are the same. How much the current crisis will impact the market and how long it will take to recover is impossible to predict. So if we can’t make any predictions with great certainty then what can we do? We can analyze the factors which are at play in the current market conditions.
April – A Rare Month
There were a total of 18 trading days in the month of April out of which the FIIs did a net outflow on two-third of the days. They made a gross purchase of Rs. 1,22,483 crores compared to the gross sale of Rs. 1,27,691 crores. So their net amount was an outflow of Rs. 5,208 crores. The DIIs on the other hand did a net outflow of 117 crores.
In the first part of the blog we have established that FIIs and DIIs trade in tandem so normally they are on the opposite sides of net balance. But in April somehow both FIIs and DIIs were net sellers.
Well there is no rule that both FIIs and DIIs cant have outflows or inflows in the same month. We have seen that during the subprime crisis. It was observed 4 times but on all the occasions they both had inflows. In over two years it was never observed that both FIIs and DIIs were net sellers.
So we understand this is not a very common scenario but how uncommon is it? To know that let’s take a broader time-frame. The following table shows more than 10 years of FIIs and DIIs inflow and outflow data, from April 2007 to April 2020.
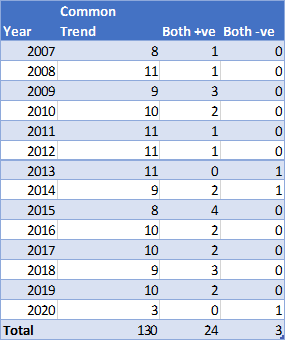
Overall in this entire time-frame such an occurrence has been observed only twice before April 2020. Is it good, is it bad, how does it impact the markets, are all questions for later but one thing is certain that this occurrence itself is quite rare.
2013 and 2014
Looking at the previous data you might be wondering what happened in those two instances i.e. in 2013 and 2014. Did the market crash?
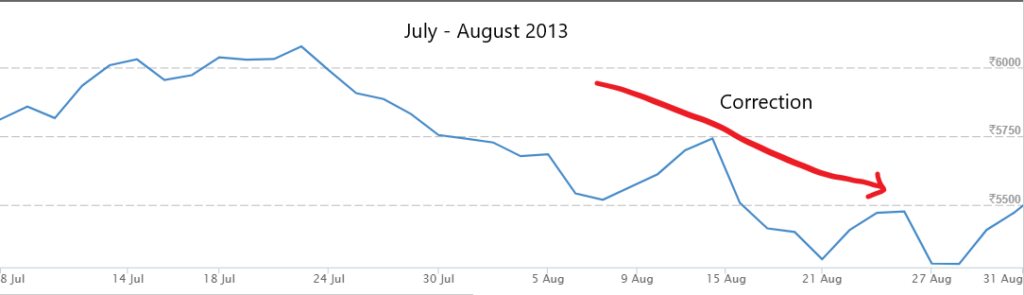
In 2013, we did see a correction of over 13% from highs of July to the lows we made in August. That seems logical. Money is flowing out, there is more supply than demand so there is a market correction.
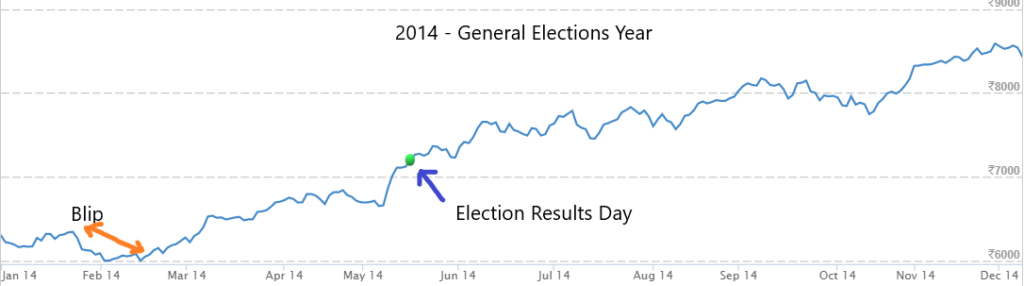
In January 2014 we saw the second occurrence of FIIs and DIIs net outflows. From the highs of January till early February we did see a blip but then there was a remarkable rally that whole year. Market rose more than 40%. Why? It was the euphoric year of general elections and riding the wave of getting a stable government the market touched new highs.
What this means is that such an occurrence may not have any long term bearing but in the short term the markets sentiments do turn negative. The institutional investors wont start withdrawing money just for fun. Also, one strong driving factor, like the euphoria of General Elections can change the sentiments in no time. In fact, after January 2014, for the next straight 8 months the net flow from FIIs stayed positive.
Is April 2020 Different?
To know that there is no better mirror than data itself so let’s put the data of all the three instances in one picture and see if they are comparable.
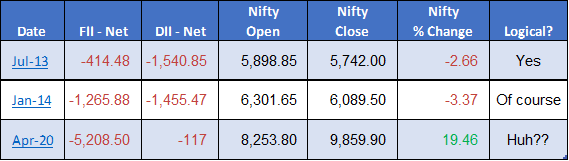
The effects seen on the markets in July 2013 and Jan 2014 were no brainers but what has happened last month. We are saying that the institutional investors have taken out more money than what they have put in and yet the market has simply shot-up.
How does that add-up? How does it even make sense? We are sitting at a rarest of rare occurrence of pessimism, the institutional investors agree to those sentiments but the market doesn’t care.
Let me share with you another piece of interesting information. Recently a very popular mutual fund trading platform, Kuvera, shared the following information with its members.

Okay, so the retail investors have increased buying which would mean that mutual fund houses should be having more cash to deploy. At the very least DIIs should have more inflow than outflow. Or does it mean that they are sitting on cash either waiting for a fall or being extra cautious due to liquidity crunch especially after the Franklin Templeton fiasco when their 6 mutual fund schemes were shut down overnight.
The Real story
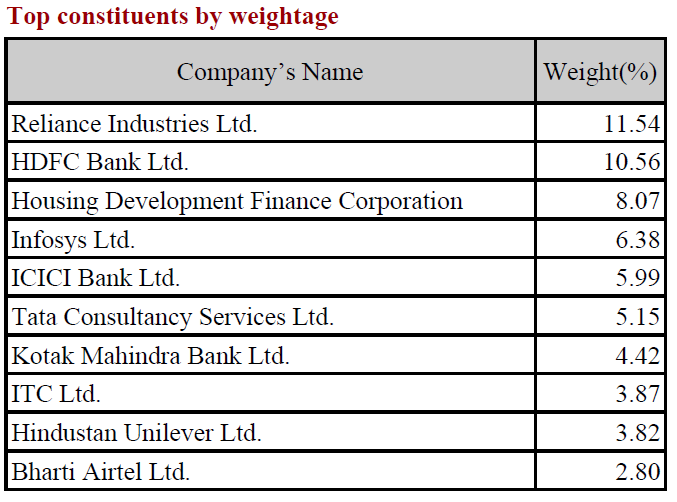
Let me touch upon a very basic aspect of Nifty which many of you would already know. Nifty index is nothing but a composition of top 50 stocks but they hold different weightages. The top 7 stocks of Nifty account for more than 50% of weightage which is led by Reliance and followed by the HDFC twins.
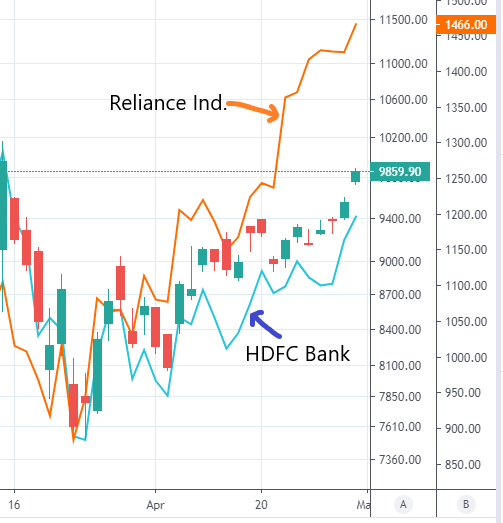
So if there is a positive movement in most of the stocks at the top of Nifty 50 it pushes the index upwards. There is also a specific term for that, ‘Index Management’. Sometimes the index management cycle is short lived which may not give a long boost to the index but if the cycle continues then gradually the upward movement rubs onto the other stocks and the index goes into a bullish rally. At least this is what explains the last week’s uptrend. A key characteristic of the Index Management Cycle is that the Index biggies like Reliance and HDFC Bank and Nifty start moving in sync. See the below chart and compare the price movement of Nifty with the other two stocks.
Now the question here is, is the Smart Money setting us up? Are they luring the common investors back into the market? We will know in a few weeks if not days.
Also, you would have noticed a big event last week. Reliance Industries has announced Rights Issue for the first time in 29 years. The issue is announced at a price of 14% discount which means after discount the investor will get one share at Rs. 1,257.
We know the Ambani family increased their shareholding in RIL by 3.2% in March. At that time the RIL share was trading at slightly over Rs. 900. So within a month the price has rocketed to Rs. 1,464 and now a discount has been offered to other investors which is still quite high from the levels it reached a month back. With RIL getting a healthy inflow just before the Rights Issue, it also had a significant positive effect on Nifty.
Also in the week before that there was a deal between Reliance Jio and Facebook after which the Reliance shares soared over 8%. This spike also added up to the overall index rally.
You can argue that there could be other factors at play. Definitely! Investors could be generally optimistic about the second stimulus package expected in May, or they could be optimistic about any vaccine or drug around the corner but does that justify the price movement we have seen in April?
May…
We have entered a month which has as much uncertainty in its name as we have in the markets. Let’s see what we may expect in the month of May with the help of technical indicators and patterns.
Following is the Nifty 50 candlestick daily chart.

You would notice that we are in an uptrend but the volume is in a downward trend. This scenario of increasing price and decreasing volume provides a classical warning of trend reversal towards a bearish sentiment.
Now let’s look at the hourly candlestick chart.

We can see that on last trading day the chart formed a Three Candle Down bearish pattern. Looking at the current sentiments there is also a possibility of formation of the Island Reversal Gap pattern but that depends on Monday’s opening. Additionally, the Nifty is close to the 10,000 mark which is also a Psychological Resistance level.
So overall with decreasing volumes the markets are gradually losing steam. Still how far can the momentum take it or are we going to see a trend reversal is something we will know in coming days.
What Should I do?
The answer to that depends on what you believe in. If you believe that the market is currently running on fumes, or not even fumes, someone is just pushing it irrationally you need not do anything unless the market starts making sense.
If you can make sense of the current market situation, if you believe that the pandemic will end soon, if the companies will have manageable impact on their revenues and things will go back to how they were earlier in near future then you continue with your existing investment plan. Either ways you still need to think about the situation and then decide how you want to proceed.
It goes without saying, this blog expresses my understanding of the current market situation. It is my opinion and not financial advice so please discuss with your financial advisor before making any decision. I hope this two parts blog series would have given you some new factors to think about in your investment journey.